Note
Go to the end to download the full example code.
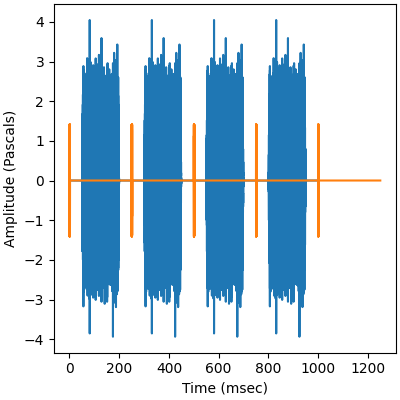
Repeating a stimulus
This demonstrates how to generate stimuli for an interleaved chirp as described by Keefe et al.
import matplotlib.pyplot as plt
import numpy as np

from psiaudio import calibration, stim, util


cal = calibration.FlatCalibration.as_attenuation()
fs = 100e3


elicitor = stim.RepeatFactory(
    fs=fs,
    n=4,
    skip_n=0,
    rate=1/250e-3,
    delay=0,
    input_factory=stim.Cos2EnvelopeFactory(
        fs=fs,
        duration=150e-3,
        rise_time=5e-3,
        start_time=50e-3,
        input_factory=stim.BandlimitedNoiseFactory(
            fs=fs,
            seed=1,
            level=0,
            fl=8e3,
            fh=16e3,
            filter_rolloff=0.5,
            passband_attenuation=0.1,
            stopband_attenuation=90,
            polarity=1,
            calibration=cal,
        )
    )
)


probe = stim.RepeatFactory(
    fs=fs,
    n=5,
    skip_n=0,
    rate=1/250e-3,
    delay=0,
    input_factory=stim.ChirpFactory(
        fs=fs,
        duration=2e-3,
        start_frequency=4e3,
        end_frequency=32e3,
        level=0,
        calibration=cal,
    )
)


figure, ax = plt.subplots(1, 1, figsize=(4, 4), constrained_layout=True)

elicitor_waveform = elicitor.get_samples_remaining()
t_elicitor = np.arange(len(elicitor_waveform)) / fs * 1e3
ax.plot(t_elicitor, elicitor_waveform)

probe_waveform = probe.get_samples_remaining()
t_probe = np.arange(len(probe_waveform)) / fs * 1e3
ax.plot(t_probe, probe_waveform)

ax.set_xlabel('Time (msec)')
ax.set_ylabel('Amplitude (Pascals)')

plt.show()
Total running time of the script: (0 minutes 0.148 seconds)