Note
Go to the end to download the full example code.
Generate bandlimited clicks
This demonstrates how to generate a bandlimited click of uniform SPL when you have an acoustic system whose output varies with frequency (e.g., an EPL-style starship).
60 60.000001373108915 59.99999879873765
40 40.000001373108915 39.99999879873765
60 60.000000069524575 60.0000000399643
40 40.000000069524575 40.0000000399643
60 74.20659021281183
40 54.20659021281182
60 73.20998939490426
40 53.209989394904255
60 65.25340722275232
40 45.25340722275232
60 73.45654136827942
40 53.45654136827942
import matplotlib.pyplot as plt
from psiaudio import calibration
from psiaudio import stim
from psiaudio import util
figure, axes = plt.subplots(1, 2, figsize=(8, 4))
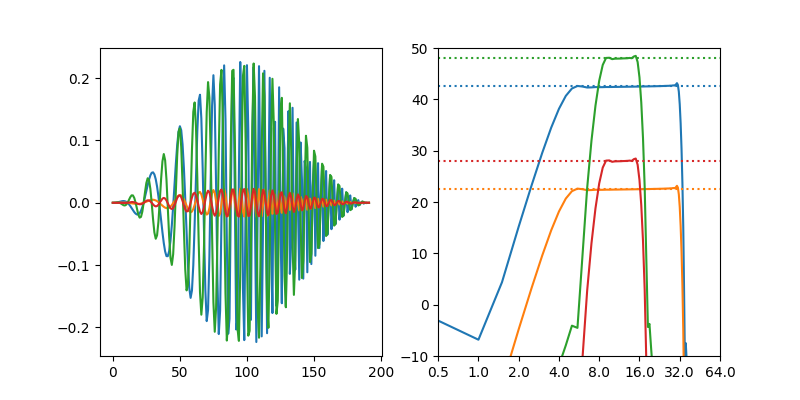
flat_cal = calibration.FlatCalibration.from_spl(80)
fs = 96e3
window = 2.5e-3
for flb, fub in [(4e3, 32e3), (8e3, 16e3)]:
for level in (60, 40):
waveform = stim.chirp(
fs=fs,
start_frequency=flb,
end_frequency=fub,
duration=2e-3,
level=level,
calibration=flat_cal,
window='hann',
)
psd = util.psd_df(waveform, fs)
spl = flat_cal.get_db(psd)
rms_spl = flat_cal.get_db(1e3, util.rms(waveform))
psd_spl = util.rms_rfft_db(spl)
axes[0].plot(waveform)
p, = axes[1].plot(spl)
sl = util.band_to_spectrum_level(level, (fub-flb) / 500)
print(f'{level} {rms_spl} {psd_spl}')
axes[1].axhline(sl, color=p.get_color(), ls=':')
axes[1].axis(xmin=0.5e3, xmax=64e3, ymin=-10, ymax=50)
axes[1].set_xscale('octave')
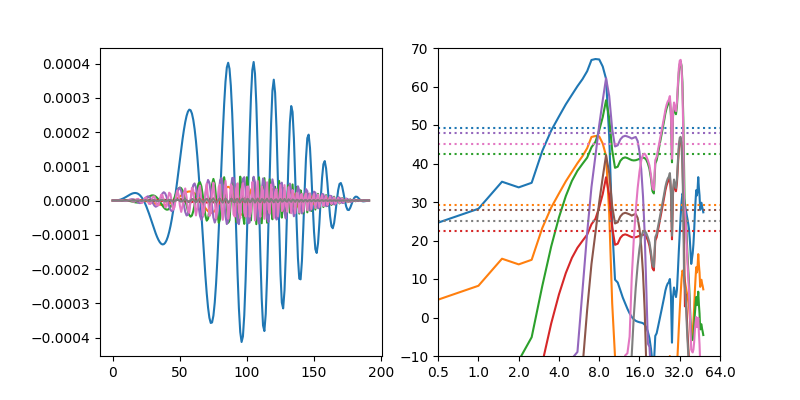
st_cal = calibration.load_demo_starship()
figure, axes = plt.subplots(1, 2, figsize=(8, 4))
for flb, fub in [(2e3, 8e3), (4e3, 32e3), (8e3, 16e3), (16e3, 32e3)]:
for level in (60, 40):
waveform = stim.chirp(
fs=fs,
start_frequency=flb,
end_frequency=fub,
duration=2e-3,
level=level,
calibration=st_cal,
window='hann',
)
psd = util.psd_df(waveform, fs)
# DC frequency is not calibrated, so we exclude it.
spl = st_cal.get_db(psd.iloc[1:])
rms_spl = st_cal.get_db(1e3, util.rms(waveform))
psd_spl = util.rms_rfft_db(spl)
axes[0].plot(waveform)
p, = axes[1].plot(spl)
sl = util.band_to_spectrum_level(level, (fub-flb) / 500)
print(f'{level} {psd_spl}')
axes[1].axhline(sl, color=p.get_color(), ls=':')
axes[1].axis(xmin=0.5e3, xmax=64e3, ymin=-10, ymax=70)
axes[1].set_xscale('octave')
plt.show()
Total running time of the script: (0 minutes 0.232 seconds)