Note
Go to the end to download the full example code.
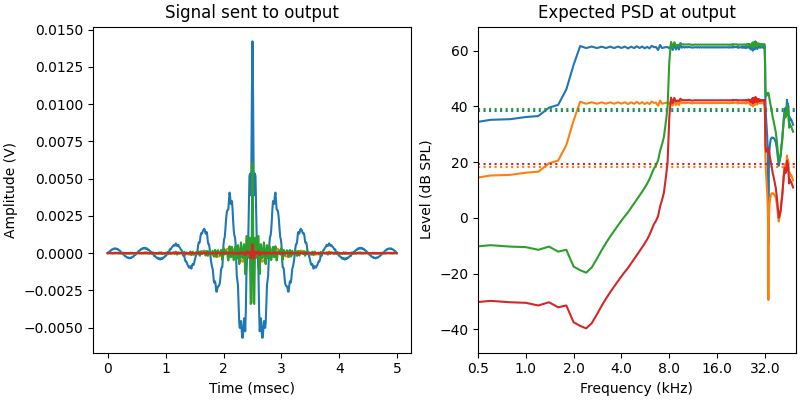
Generate bandlimited clicks
This demonstrates how to generate a bandlimited click of uniform SPL when you have an acoustic system whose output varies with frequency (e.g., an EPL-style starship).
60 97.24024322318667 83.03937589070819
40 77.24024322318667 63.03937589070817
60 90.81744154930465 83.0488959765596
40 70.81744154930465 63.04889597655962
import matplotlib.pyplot as plt
import numpy as np

from psiaudio import calibration
from psiaudio import stim
from psiaudio import util

figure, axes = plt.subplots(1, 2, figsize=(8, 4), constrained_layout=True)

cal = calibration.load_demo_starship()
fs = 96e3
window = 5e-3

for flb, fub in [(2e3, 32e3), (8e3, 32e3)]:
    for level in (60, 40):
        waveform = stim.bandlimited_click(
            fs=fs,
            flb=flb,
            fub=fub,
            window=window,
            level=level,
            calibration=cal,
            equalize=True,
        )

        t = np.arange(len(waveform)) / fs
        psd = util.psd_df(waveform, fs)

        # We exclude the DC frequency since this is not calibrated and we
        # would get a calibration error otherwise.
        spl = cal.get_db(psd.iloc[1:])
        psd_spl = util.rms_rfft_db(spl)
        pe_spl = cal.get_db(1e3, np.ptp(waveform))
        print(f'{level} {pe_spl} {psd_spl}')

        axes[0].plot(t * 1e3, waveform)
        p, = axes[1].plot(spl)

        sl = util.band_to_spectrum_level(level, (fub-flb)*window)
        axes[1].axhline(sl, color=p.get_color(), ls=':')

axes[0].set_xlabel('Time (msec)')
axes[0].set_ylabel('Amplitude (V)')
axes[0].set_title('Signal sent to output')

axes[1].axis(xmin=0.5e3, xmax=50e3)
axes[1].set_xscale('octave')
axes[1].set_xlabel('Frequency (kHz)')
axes[1].set_ylabel('Level (dB SPL)')
axes[1].set_title('Expected PSD at output')

plt.show()
Total running time of the script: (0 minutes 0.208 seconds)